
How To Create and Import Tables with Desygner

Do you need to express data cleanly and clearly?
Is deciding which infographic to use for your brand design a headache?
Or perhaps you can’t wrap your head around how to import and create tables using Desygner?
You’ve come to the right place. Here we’ll be discussing everything tables- how they differ from charts, when to use them and how you can create them using Desygner.
Charts and Tables: When To Use Which
Differentiating Between Charts and Tables
Before we delve into when to use a particular infographic, let us first differentiate between charts and tables.
Charts have the unique capability of displaying raw data in a visual form. Though they may be present in many different iterations within your graphic design, all charts retain the ability to display a great deal of data in a simple and comprehensible way, aiding both readability and comprehensibility.
On the other hand, tables consist of data arranged within columns and rows. Oftentimes, this data contains gridlines separating each data segment (more commonly referred to as a tabular data view).
Similar to the aforementioned, the infographic, charts, and tables too can display text, color, symbols, or any other relevant information. However, unlike charts, tables may contain a wide variety of data, ranging from uni-dimensional to multidimensional data sets.

When To Use a Chart
When faced with complex data that needs to be simplified and presented for trend identification, you should always opt for a chart.
Simplicity and comprehensibility go hand-in-hand. Pattern recognition becomes a facile task with displayed data, allowing you to observe trends in that data. When it comes to future planning, using charts is often referred to as money for the old rope, providing highly reliable data at a meager cost.
If in doubt, always opt for a chart rather than a table. However, it is very easy to overuse charts. Therefore it is always important to remember that you should always pick out the key information and use the most appropriate infographic.

Create Infographics Now for Free
When To Use a Table
Precision is integral to tables. When readers require precise details, as is the case with prices for different services, it is only natural to opt for a tabular approach.
A table is the best option if you have data that needs to be analyzed in detail, is less abstract, and requires a close examination of individual results. The table also comes in handy when conducting data replication, allowing you to have multidimensional information in one set. Moreover, when it comes to graphic design, using a tabular approach can allow you to list data in a compact, minimalized manner, which is bound to impress your prospective customers.
Furthermore, tables will always be your savior when it comes to displaying multidimensional information.

How Can You Create A Table Using Desygner?
Let’s start with the basics: How can you create a table using Desygner?
Creating a table in Desygner may seem daunting, but in reality, it’s nothing more than a cakewalk.
Creating tables in the Editor section is quite similar to how you’d make a table in a word document:
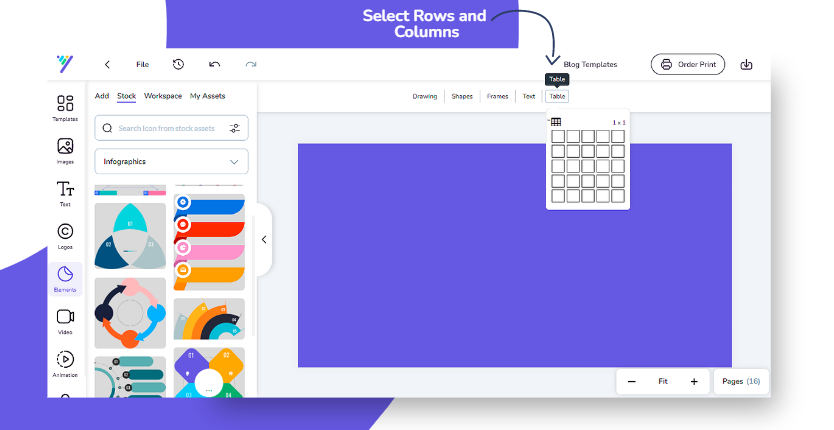
Step 01: Start by using the diagram to select the dimensions (rows and columns) required
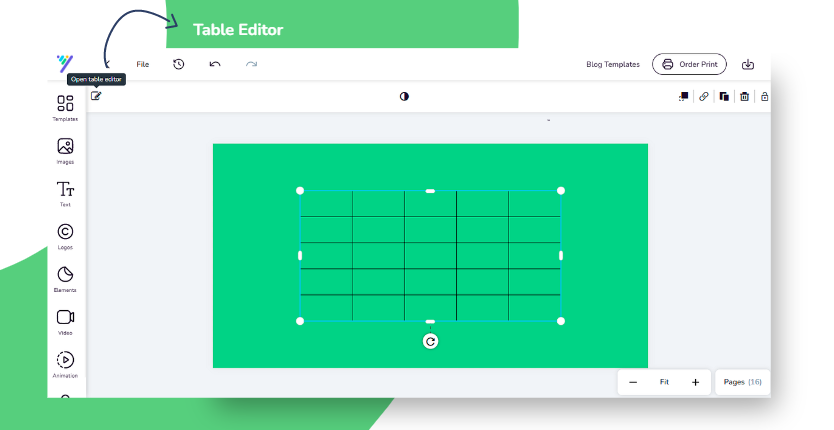
Step 02: Next, open the Table Editor to start customizing the table
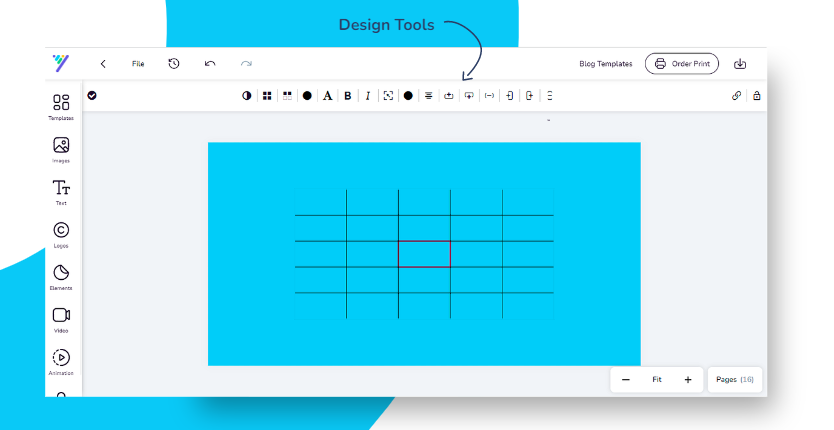
Step 03: You can then opt to edit the table using any of the following tools: Opacity, Cell Background Color, Cell Text Color, Italic or Bold Text, Content Alignment, etc.
Unlike Microsoft Word, you can use Desygner for a plethora of other features. Using built-in design tools allows you to customize the whole template. Alternatively, you can choose to select pre-designed templates.
The list doesn’t end here. With Desygner, you can also add images, icons, logos, and stickers. Last but not least, you can also animate your design. The possibilities are endless!
Convert PDF and InDesign Files into Editable Templates
You can easily create and edit tables in Desygner’s Editor, but you can now import your PDF files through Desygner’s PDF Editor and customize tables!
With the new InDesign Plugin, you can rest assured that you’ll be able to import designs with technical details, including tables, and edit them at a reduced cost: say goodbye to overly expensive brand design!
InDesign Plugin
With Desygner, you can now import and edit your brand’s design by simply importing InDesign files with technical design and subsequently converting them into branded customizable templates. Using this feature, you can allow non-professional designers or team members to make their own alterations.
This allows your brand to produce design faster and increases the inflow of graphic design ideas. Besides the plugin, we also have an alternative to InDesign.

PDF Editor
Using Desygner, rebranding PDFs becomes a cakewalk. Desygner automatically imports the right logos and never re-inforces rebranding files. The result? You’ll never have to worry about a customer accidentally seeing a wrong or missing logo on a document again!
That’s not all. With Desygner’s unique file format, all your formatting, editing, and fonts will be preserved as-is. Whether you want to edit the entire document or individual pages, you can do either without compromising on quality.

Final Thoughts
Using Desygner, you can ensure that data is represented in the most appropriate form possible. Regardless of infographics, you can rely on Desygner to ensure that your data is present in the most concise and uncluttered form possible.
To conclude, it must be reiterated that at the end of the day, a good brand design gets the message- and maintains a certain level of uniqueness while doing so!


